Welcome

Thanks for visiting the Mike's Make blog. It is a compilation of many of my interests. I hope you find the articles in this blog helpful and entertaining. Leave a comment and let me know what you think.

Wednesday, May 30, 2012

Method for Optimizing CNC Machine G-Code Programs
 by Michael Shaw, May 2012

This article explains a simple and inexpensive method I use for making the axis movements of my CNC machine more efficient (optimizing). There may be program packages available that optimize G-code for you, but here’s a method I came up with that will do something similar, but using software you probably already have, like Microsoft Excel. 
 I use drawing programs such as AutoCAD and Draft Sight to create my designs, and then process the drawing file with the .dxf extension through a program called Ace. This creates the G-code program file, but unfortunately there is no rhyme or reason for the order of the axis movements that is produced.        
There are several reasons you might want to optimize the G-code programs for your CNC machine; one of them is to reduce the time needed to operate the machine. If the G-code tells the CNC machine tool to move from one side of the table to the other and back again, the process will take longer than if the CNC machine tool moves in an orderly fashion. By optimizing your G-code program you can save a significant amount of time. 
An example is a G-code program I made for drilling holes in a printed circuit board (PCB). A map of the axis movements before optimization is performed is shown in figure 1, and the axis movements after optimization is shown in figure 2.

Figure 1, drill locations before optimization

Figure 2, drill locations after optimization
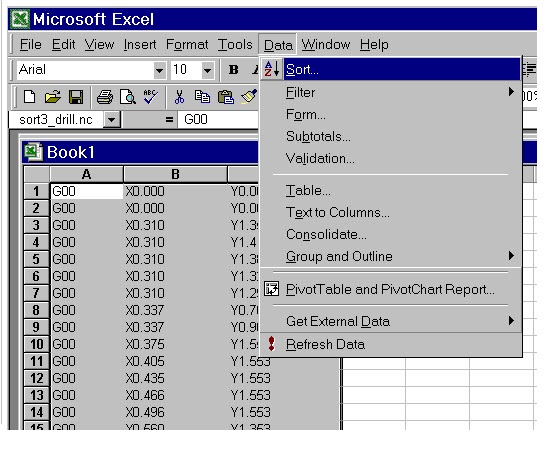

The G-code program in figure 2 actually ran 5% faster than the program in figure 1. How did I do it? It’s simple; I import the G-code X-Y coordinates into an Excel spreadsheet and then use the sort function in Excel to arrange the coordinates in ascending order as shown in figure 3.


Figure 3, Excel Sort Function

When I’m done, I save the spreadsheet as a Text (tab delimited) file then add the z-axis movements and comments to the file and then I’m done.  

One last note about using this method, in the example above I sorted the data by the B column (X-axis), but I could have just as easily sorted the data using the Y-axis. This method is not a perfect solution for optimizing your G-code, but it’s a start.


Thursday, May 17, 2012

Precise Touch-off Method for CNC Machine PCB Routing
by Michael Shaw, October 2011


This article explains a method I use for determining the exact location of the top of an electronic Printed Circuit Board (PCB) when machining traces using a CNC machine. I have been using this method to perform the Z-axis “touch-off” for a year now with great success and thought it would be great to share it with you. 

Determining the top of a PCB is important for controlling the depth of the bit when machining a PCB. The router bit will wear less and you can achieve better detail and cleaner traces by limiting the depth of the router bit.

Methods I used in the past were hit or miss, at best. You could eyeball the height of the bit over the PCB, but you risked breaking a bit or being way off on the depth. You could also use a method I once read in an electronics magazine. This method used a piece of paper (paper is about .005” thick) placed between the PCB and the bit. After each incremental jog of the Z-axis, moving the paper around would determine if it was captured between the bit and the top of the PCB. If it was, then you were at the top of the PCB, minus .005”, give or take.

The method I developed is more precise. It requires a multimeter, ohmmeter or other device for checking continuity. The meter will be used to detect a complete circuit when the router bit touches the top of the PCB.

To perform this technique, clip one lead of the meter to the bit and the other lead to the top of the PCB. In the figure 1 illustration, you can see in the upper left-hand corner the black lead of the Fluke 27 multimeter clipped onto the bit and in the lower right-hand corner you can see the red lead of the Fluke meter secured against the top of the PCB under the clamp.        

Figure 1, meter connection

Switch the meter to the “diode” mode so the meter will produce a tone when the two leads make continuity (touch).


Note of caution: you might want to verify the correct operation of the meter to make sure it beeps when the leads are touched together before performing the next step.


Slowly jog the Z-axis down until you hear a beep from the meter (I use a jog increment of .001”). When you hear the meter beep you know the bit is touching the top of the PCB. Now you can define your touch-off point from this location.

One last note about using this technique, although this method can precisely locate the top of the PCB in a given location, if the CNC table or the PCB is not level, then the top of the PCB is going to vary. So this method could also be used as a tool to help with leveling the CNC table or PCB.   

Tuesday, May 15, 2012

Design of a Utility Interactive Photovoltaic (UIPV) System

Part 1 - Power Requirements
Why not power the whole house? This can be done, but it will be expensive and a lot of people don’t have those kinds of resources. But you should figure out how much electrical power you do use. This will vary from day to day and month to month but you can determine your electrical usage by looking at your past electrical bills. This may enlighten you to how much electricity you use and how it is sometimes taken for granted.  A lot of this information is now easily accessible online. For instance, Florida Power and Light provides billing graph histories that keep track of your electrical usage in both dollar amounts and electrical usage. This makes it even easier to analyze the size requirements of the PV system. In determining the requirements of a PV system to be used in my house, I accessed my electrical usage from the FP&L website.  I determined that the best use of a PV system would be to try to minimize the effects of the peak usage rates when electricity demand exceeds 1000KWh in a month. I found that on average I exceed this value by 338kwh. About 4 months of the year I have high demand where I expect not to make this goal, but the rest of the months I should.      


So how much do you spend on a PV system and why? Try to determine the best return on your investment and what you can afford. Sometimes the system will pay for itself faster if you balance the initial investment with the potential payback. And yes, unlike other investments, this system will eventually pay for itself if quality materials and workmanship are used during the installation and the system has the proper maintenance during it’s lifetime. One way to balance your initial investment with the potential payback is by avoiding increased rates for excessive electricity use. For instance, FP&L charges higher rates for monthly electricity usage that exceeds 1000KWH. (See graph 1). Not only that, but FP&L additional chargers include a 1% storm charge, a 6.23% franchise charge, a 2.5% gross tax and a 5.84% utility tax. That’s a 15.57% tax based on the amount of power usage. This is not going away anytime soon.  If you can avoid having to pay for electricity at these increased rates, your return on investment will be greater and payback will be quicker.  Another thing to consider is the point at which rebates and incentives kick in. 
So how much do you spend and why? Try to determine the best return on the investment you will make and what you can afford. Sometimes the system will pay for itself by avoiding increased rates of excessive electricity use.  For instance, FP&L charges higher rates for electricity usage that exceeds 1000KWH (See graph below).
This higher rates is around 17% higher than the rates for electricity usage under 1000KWh. If you can avoid having to pay for electricity at these increased rates, which  then your return on investment will be greater. 


The PV Calculator located on the Kyocera website at http://www.kyocerasolar.com/products/pv_calculator.html is a way to determine the approximate cost of a PV system. This site uses cost per watt, local utility rates, annual utility cost and PV system size to calculate how much a PV system will cost, how much of the cost will be covered by energy initiatives, and how much you can save on your monthly bill. 


Protect yourself against higher Electricity costs in the future. In February 2000 electricity costs were .04217 for first 750KWh and .05217 after that. The fuel charge was constant at a .0187. FP&L changed the way they calculated electricity costs and now charge .04134 for the first 1000KWh and .05166 for electricity after that. The fuel charge is also a variable rate based on consumption and ranges from .06021 for the first 1000KWh and .07021 for electricity after that. I guess you could say FP&L lowered their rates but in real terms electricity costs have gone up over 67%.


Part 2- system design

Sunday, May 13, 2012

Hello World!

Signing on with the classic computer practice phrase. Starting a blog sounds like I never did anything online, but I actually have been online back when Compuserve was around. I have been waiting for this fad to change into something a little more permanent over the years, but I guess it's ever-changing edifice will be here to stay. Having an electronic presence is a must these days, so bear with me as I present my inner most thoughts with you, and the rest of the world.